Observability for Small Teams: Logs, Metrics and Traces
You do not need a platform team to know what your system is doing. Three signals and a few habits go a long way.

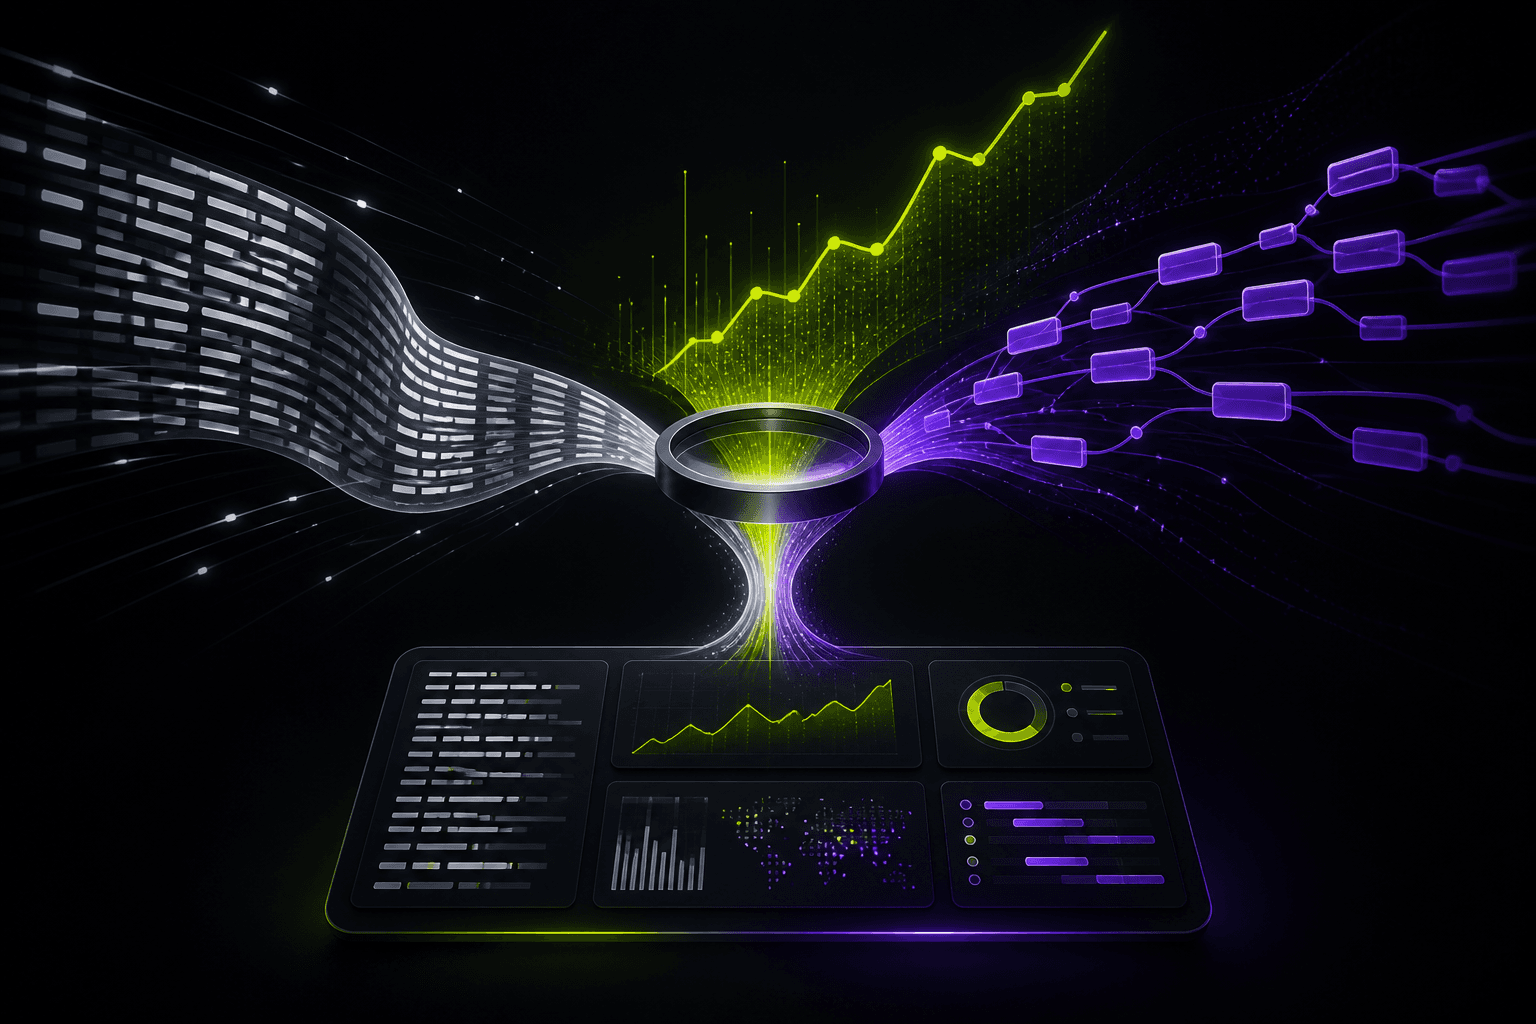
Observability sounds like an enterprise concern, but small teams need it more, not less. With few people on call, every incident has to be diagnosed quickly, and the system has to explain itself. The three classic signals, logs, metrics and traces, each answer a different question.
Logs answer "what happened here?" Write them as structured JSON with a consistent set of fields: timestamp, level, request ID, user ID when appropriate, and a message. Avoid logging secrets and full personal records. Structured logs can be searched and aggregated; free-form text cannot.
Metrics answer "how is the system doing over time?" Request rate, error rate and latency percentiles per endpoint cover most needs, along with queue depth and database connection usage. Alert on symptoms users feel, such as error rate and latency, rather than on every internal fluctuation.
Traces answer "where did the time go?" A single request ID propagated through web handlers, database calls and background jobs turns a slow endpoint from a mystery into a list of spans with durations. Most frameworks and hosting platforms support this with little code.
Start with what your platform already provides, add a request ID to every log line, and build one dashboard you look at daily. Observability is a habit before it is a toolset.